How a Learning Model improves Traffic Jam and shortens routes in Shanghai

By Jonathan Xu
Director of Business Operations and Marketing
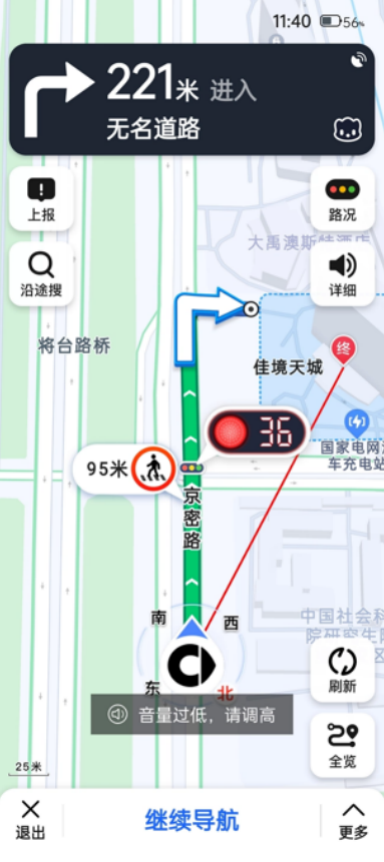
A couple of days ago, we took a taxi to meet with one of our members. As we were standing in traffic, we noticed the driver’s GPS system was able to tell him when the red light ahead of us would be turning green. This was both shown on the screen as well as mentioned by the voice assistant.
We immediately started further inquiring, where he mentioned it was a new function of AutoNavi Maps (a leading GPS and mapping company). We quickly noticed the visual countdown was very accurate: only a 2- or 3-seconds difference with the actual state of the red light. But how does this really work?
Observations
Showing the countdown of red lights on the driver’s phone has multiple advantages, such as improving traffic efficiency, decreasing the risk of creating traffic jams due to inattentive drivers etc. Is the GPS app linked to every traffic light in this city with more than 25 million inhabitants? Or is the camera on the backside of the phone registering the countdown on the light itself? Let’s do some research! There are no official channels that provide information on this matter and everything we discussed in this article is based on research from various organizations.
Hardware + Internet of Things Theory
What if this were to be linked to Industry 4.0, whereas lean technologies would be upgraded with aspects from the Industry 4.0 trends? In this case, AutoNavi would have to cooperate with different traffic control departments in various cities and prefectures. This would also require them to purchase additional hardware, modify each and every light, etc. The additional hardware would also need to be adjusted to endure extreme weather. Which party would be responsible for required investment needed to ‘upgrade’ all the traffic lights? What about the traffic lights that change the duration of the red light and green light during rush hour?
This theory is technically feasible, but given the fact that various costs would pop up, it seems very probable that this is not the right solution. Installation costs, maintenance costs and other intangible costs such as the coordination between different traffic control departments make this idea seem too much of an investment to actually be true.
Government Traffic Control Platform Access Theory
Could access to the government’s Traffic Platform overcome the challenges of hardware upgrades and high coordination costs in traffic management? Could AutoNavi tap in into this platform and obtain data?
We believe this option to be impossible: apart from data security concerns, there is is also a fundamental paradox. If AutoNavi acquires data solely from the traffic control platform, why don't they implement countdowns for all intersections? Why is only a portion of intersection data available while the rest remains inaccessible? In other words: getting real-life data from each light seems a bit farfetched, since AutoNavi provides this service, even for lights that do not possess the countdown function.
Big Data Mining Theory
If neither hardware nor a platform is the answer, what other options are available? Big data mining presents itself as a viable solution. Here are some benefits of this approach:
- Internal Coordination: Big data mining relies solely on internal coordination within the organization's project team. It eliminates the need for external dependencies and allows for self-control of the process ;
- Utilizing Existing Core Data: The mobile terminal provides access to the existing core data, and with a large enough Daily Active User (DAU) base (again, 25 million inhabitants), substantial data can be obtained. Notably, the top two domestic navigation platforms, such as AutoNavi and Baidu, contribute to this data pool ;
- Analyzing Intersection Traffic Flow: By examining intersection traffic flow data, including quantity, quality, and confidence levels, it becomes possible to determine whether location information mining is even necessary. Non-central intersections often have lower traffic volumes, resulting in limited data availability. Improving data cleanliness and achieving higher confidence levels will become more challenging in this case. Consequently, this explains why the capability to mine location information has not been launched for non-central intersections with smaller traffic volumes.
‘Simplicity’, in theory
What if the solution is in fact much simpler: what if it’s a piece of code, a ‘simple’ software solution? Let’s have a look at which data would be needed in order to write a code that can predict the countdown time. Let's take the example of determining the duration of a straight red light and green light at an intersection. Based on the information provided, we can begin by verifying whether the driver is actively using a navigation system.
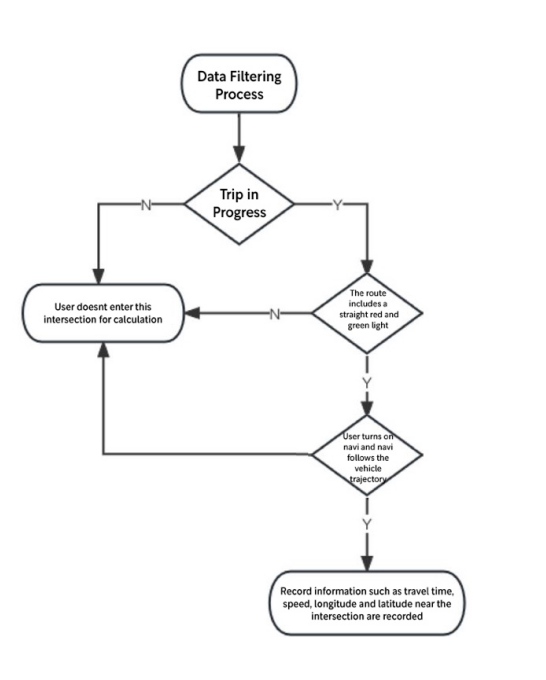
Next, we need to check if the intersection under consideration falls within the user's current planned route. If it does, we can focus on monitoring the vehicle's performance before and after the traffic light, specifically observing changes in speed and/or waiting times. By utilizing these criteria, we can effectively collect the relevant data and proceed with implementing the software solution.
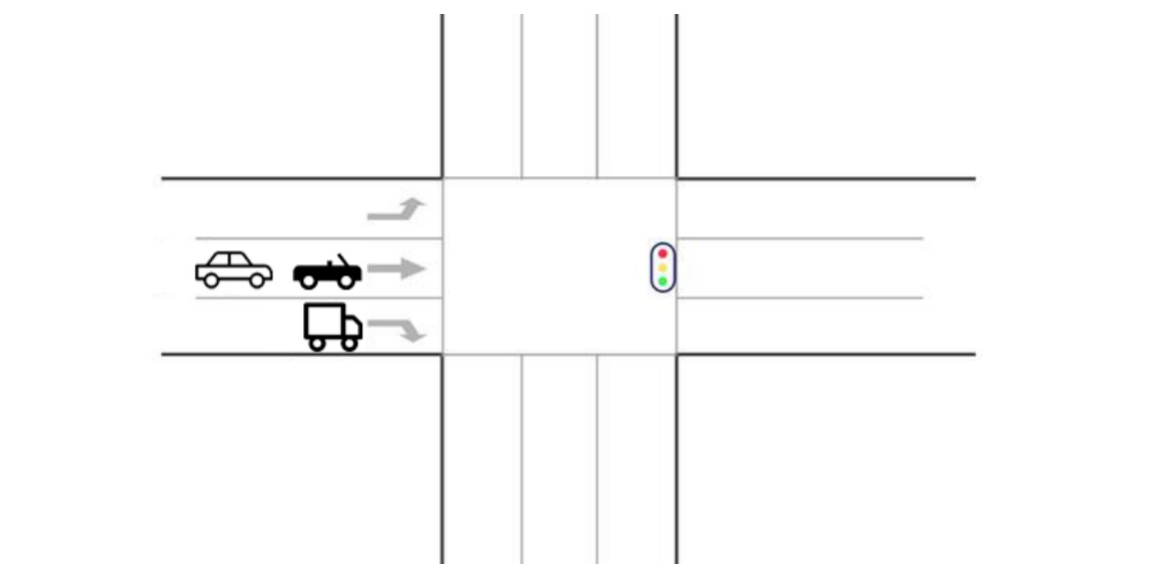
A simple flowchart below puts this theory and data acquisition and filtering process into perspective. When considering an intersection as shown in the figure above, we first also consider traffic restrictions of different lanes : only the middle lane can go straight, so the subsequent left-turning and right-turning vehicles can be ignored, and only those vehicles arrive at the right side from the left side of the intersection in the current top view.
‘Simplicity’, in practice
In this particular case, our focus will be on analyzing the driving data of the regular car and sports car depicted in the picture. The truck turning right, on the other hand, can be disregarded as its data has minimal impact on accurately assessing the duration of the current straight traffic light. By prioritizing the driving data of the relevant vehicles, we can effectively determine the appropriate judgment for the duration of the straight traffic light.
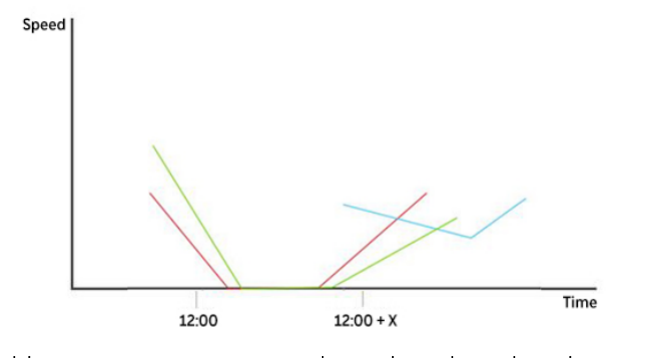
Next, let's examine the speed variations of different vehicles in the vicinity of this intersection. The concept of proximity can be determined by considering factors such as the distance from the previous intersection to the current one, or by establishing a limited distance threshold, or a combination of both. To illustrate this, let's focus on the current intersection and create a two-dimensional coordination system that represents the speeds of vehicles passing through the intersection at various times of the day. By plotting these data points, we can observe and compare how the speeds fluctuate over time. For the sake of demonstration, let's consider three cars and a traffic light cycle. We will attempt to create a visual representation of this scenario by plotting the data points accordingly.
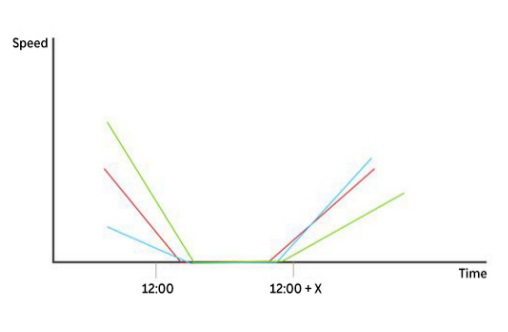
The varying speeds of different vehicles near the traffic light, as well as the number of vehicles coming to a stop, influence the acceleration and braking rates, ultimately impacting the slope of the curve (assuming linear acceleration changes). Consequently, this leads to differences in the duration of time spent at a complete stop.
In the case of the three vehicles mentioned, the green car stops and starts the latest, while the red car stops and starts the earliest. Thus, it is highly likely that the red car will be ranked first in terms of stopping time, followed by the blue car, and finally the green car.
The cumulative parking time of these vehicles occupies the duration of the red light phase of the traffic light. Expanding on this example, let's consider a scenario where two cars need to come to a stop and start again at a traffic light, while another car continues driving through when encountering a green light. The behavior of the red car and green car aligns with the previously mentioned pattern. During the period after they start and accelerate, the blue car enters the scene at a certain speed, subsequently decelerates (typically slowing down at intersections), and then accelerates again. By observing this sequence, we can determine that the time interval for the blue car corresponds to the green light period immediately following the red light period. Subsequently, it enters the cycle of the subsequent traffic light phase.
Expanding on the previous example, let's now consider the scenario where right turns are allowed in addition to going straight. This situation adds further complexity compared to before. When a vehicle intends to go straight on a red light, the vehicle positioned on the rightmost lane, even if going straight, will still come to a complete stop, reducing its speed to zero before starting again. This process is similar to what we discussed earlier.
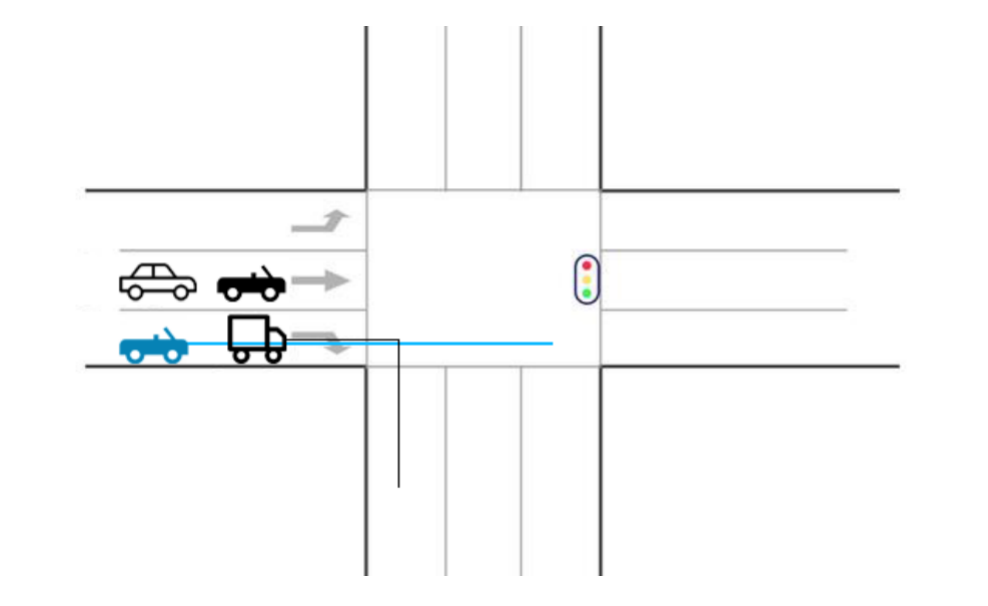
However, if the traffic light turns green at this moment, pedestrians and electric vehicles going straight may cause the vehicles attempting to turn right to stop and wait. As a result, the vehicles in the right lane that were initially going straight will inevitably need to wait as well.
Referring to the provided illustration, we can observe the blue vehicle, which needs to continue going straight, and the gray vehicle, which intends to make a right turn (indicated by the corresponding color lines depicting their upcoming trajectories). The question arises: How should we handle the data of the vehicle that has already gone straight at this point in time?
In this situation, we would need to consider the impact of the right-turning vehicles and any delays caused by pedestrians and electric vehicles going straight. These factors can influence the trajectory and behavior of the vehicles that have already proceeded straight. Thus, it becomes essential to carefully analyze and incorporate this additional data when making further assessments or predictions.
Conclusion
We have explored various theories and considerations surrounding the implementation of a countdown system for traffic lights on an app. While hardware upgrades and direct access to government traffic control platforms present challenges and limitations, the theory of leveraging and acquiring big data mining emerges as a viable solution. By acquiring and analyzing internal data, such as driving behaviors and intersection traffic flow, a software-based approach could be developed to accurately predict the countdown time for traffic lights. This approach offers advantages such as internal coordination, utilization of existing data, and flexibility in adapting to different traffic scenarios. While further research and development are needed to refine and implement such a system, the potential benefits in terms of improving traffic efficiency and reducing congestion make it an intriguing avenue to explore…

